How to Use the Analytic Funnel on Your Dashboard
Turn any metric card on your Analytics dashboard into a funnel to see how many contacts survive each stage of your pipeline, and exactly where they drop off. Covers switching the view, building layers, reading the conversion figures, and saving.
Also searched as: How to Use the Analytic Funnel on Your Dashboard, Open Analytics and pick a card, Switch the card to Funnel, Open Funnel Layers, Choose what the stages are made of, Add your stages, in order, Read the funnel, Save it, Good to know, Analytic, Funnel, Dashboard
Every business has a leak — a point where leads go quiet, conversations stall, or deals stop moving. A normal chart gives you the total; it does not tell you the turning point. The Analytic Funnel does: it breaks a metric you already track into stages and shows how many make it from each one to the next.
💡 Funnel is a way of viewing a card you already have, not a new kind of card. You pick any metric on your dashboard, switch its view to Funnel, then say what the stages are. And nothing is stored until you press Save — until then you can experiment freely and just navigate away.
Before you start
- You need the Analytics page in the left sidebar. Teams on the API-only plan do not have it — that plan shows only Channels and Getting Started.
- You need edit access to the dashboard you are changing. Without it the Save button is replaced by Request Edit Access.
- Stages are built from your tags, channels or team members — so it helps to already tag chats for the stages of your pipeline.
Step-by-step
Step 1 — Open Analytics and pick a card
Open Analytics from the left sidebar. Choose the metric you want to break into stages — Total Customer Chats is a good first one. If the metric you want is not on the dashboard yet, add it with + Add Data at the top right.
Hover over the card. A small row of buttons appears in its bottom-right corner — that is the card toolbar, and everything below happens there.
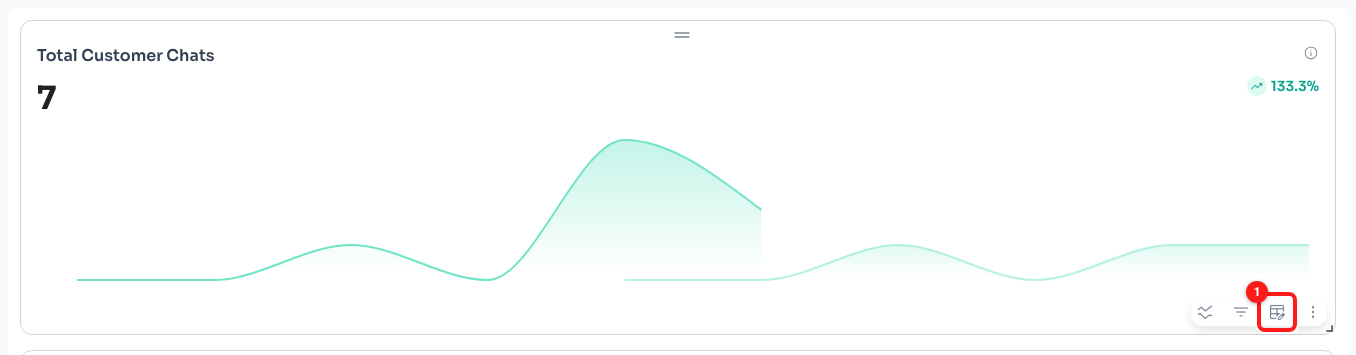
Hover a card to reveal its toolbar. The Change Visualization button (1) is the one that switches the card to a funnel.
Step 2 — Switch the card to Funnel
Click Change Visualization and choose Funnel from the list. The same list holds Line Chart, Pie Chart, Table, Snapshot and Metrics, so you can switch back at any time without losing the card.
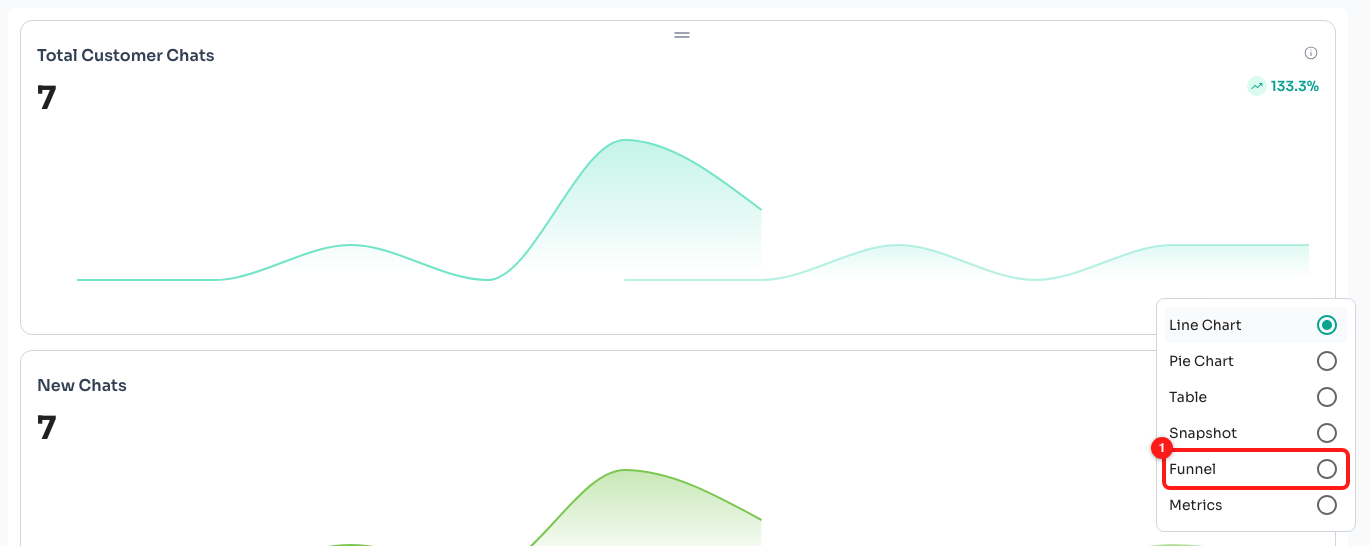
Pick Funnel (1). The other entries are the views you can switch back to.
Step 3 — Open Funnel Layers
The card redraws as a funnel, and a new Funnel Layers button appears in the toolbar — it only exists while the card is a funnel. A funnel with no stages set up yet reads No Data, which is expected: you have not told it what the stages are. Click Funnel Layers to do that.
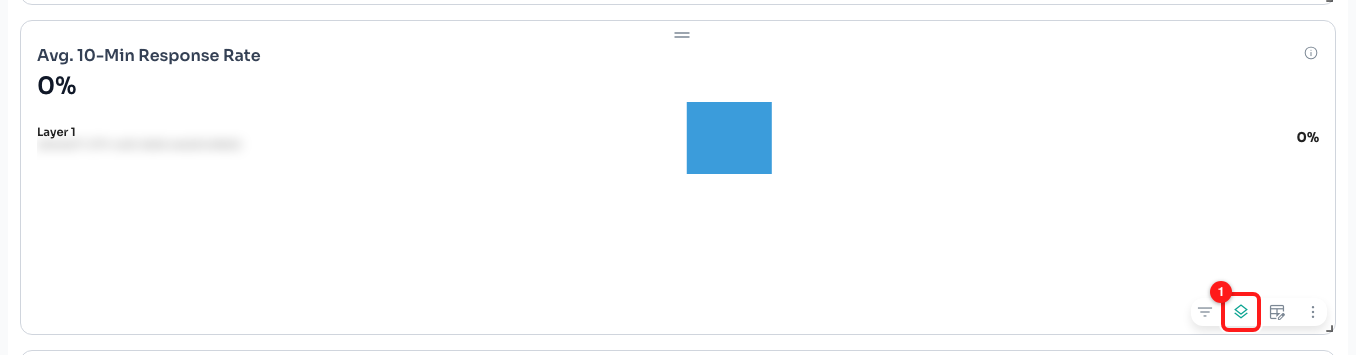
A card being viewed as a funnel, with one stage configured so far. Funnel Layers (1) is the layers button on the toolbar.
Step 4 — Choose what the stages are made of
In the Funnel Layers panel, set Group by first — this is what your stages will be built from. You can group by tag, by channel, or by team member; other properties are not offered here, because they belong in the ordinary filter instead. Until you choose one, the panel says “Select a grouping to configure layers” and Add Layer stays greyed out. Once you have chosen, it invites you to add layers to group those values into funnel stages.
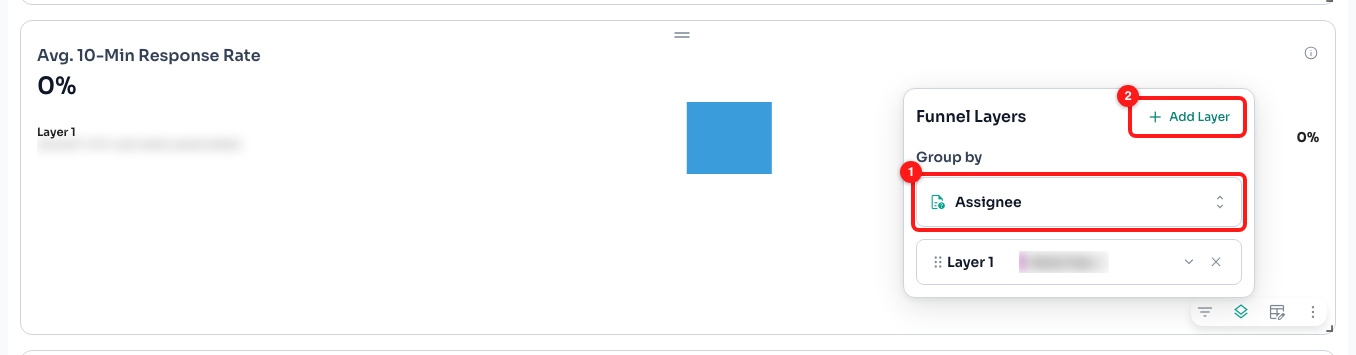
Set Group by (1) before anything else — this example groups by team member. Add Layer (2) only becomes available once a grouping is chosen.
Step 5 — Add your stages, in order
Click Add Layer once for each stage of your pipeline, top to bottom, widest first. Each new layer is called Layer 1, Layer 2 and so on — double-click the name, or use the pencil next to it, to rename it to something you will recognise: Enquired, Quoted, Paid.
Open a layer and pick the values that belong to that stage — the tags, the channels or the team members. When your stages are built from tags, each layer also gets a choice of OR · Match Any (a chat counts if it has any of the chosen tags) or AND · Match All (it must have all of them). Drag the handle on the left of a layer to reorder it; the ✕ removes it.
Step 6 — Read the funnel
Each stage is a bar, with its name on the left and its real count on the right. Between two bars you get ↓ NN% conversion — how many of the previous stage made it to this one. That is your drop-off. Under the count, from the second stage onwards, NN% of total compares that stage against the first one, so you can see how much of the original intake is left by the end.
The whole funnel obeys the date range and interval at the top of the page, so you can compare the same funnel across last week and last quarter just by changing the period.
Step 7 — Save it
Press Save at the top of the dashboard. It appears as soon as you have changed something, and nothing you have done is stored until you press it — if you navigate away first, the funnel goes back to how it was.

Save (1) is what commits the funnel to the dashboard. It only shows up once there is an unsaved change.
Good to know
- Filter and Funnel Layers do not mix. A funnel card uses one or the other — if one is set, the other is disabled with the note “You can use either Filter or Funnel Layers, not both. Clear the other to switch.” Clear whichever you are not using.
- Split data disappears on a funnel card. The layers are the split, so the ordinary breakdown button is hidden while the card is a funnel.
- Order matters. Conversion is always measured against the layer directly above, so put your stages in the order they really happen.
- Switching back is safe. Change the view to Line Chart and your layers are still there when you switch to Funnel again — as long as you have not saved over them.
Frequently asked questions
My funnel says "No Data".
That is a funnel with no layers configured yet. Open Funnel Layers, set Group by, and add at least one layer.
It says "No matching data for configured layers".
The layers are set up, but nothing in the selected period matches them. Widen the date range at the top of the page, and check that the tags, channels or team members you picked are the ones actually being used on your chats.
Why can I not pick the property I want to group by?
Stages are built from tags, channels or team members only. Other properties can still be used as an ordinary filter or breakdown on a non-funnel card.
A later stage is bigger than an earlier one. Is that a bug?
No — it means more chats match that layer than the one above it, usually because the stages are out of order, or because a tag is being applied to chats that never passed through the earlier stage. Reorder the layers into the real sequence and check which values each layer holds.
I see Request Edit Access instead of Save.
You are viewing a dashboard you do not have edit rights on. Ask whoever owns it to give you edit access, or build your funnel on a dashboard of your own.
Can I export what the funnel shows?
Yes — there is an Export button at the top of the Analytics page for the whole dashboard, and More Actions on the card toolbar has a download option for that one card.